NIO Buffer performance
As an indication of certain performance properties of NIO buffers, the graph below
compares the time taken to put an int array into a buffer. Comparisons are made
between three buffer types (for more details of the test conditions, see below):
- a ByteBuffer backed by a byte array, writing the int array via
an IntBuffer wrapper (obtained via ByteBuffer.asIntBuffer());
- a direct ByteBuffer, again with an IntBuffer wrapper;
- a normal ByteBuffer, writing the int array with single-int put() in a loop.
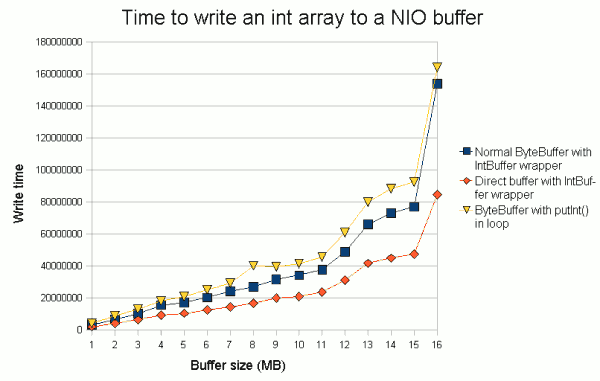
These tests show that:
- there is a slight benefit in using the IntBuffer wrapper buffer
(around a 20% performance improvement on average);
- significantly, writing to the direct buffer is
around twice as fast.
The test machine in this case was a 2GHz Pentium 4 under Windows, running Java 6.
For each buffer size and buffer type, timings were averaged over 20 repetitions, filling the int
array with new random numbers each time (to try and keep processor cache effects comparable across tests).
As in the tests carried out here generally, the test program also made some initial "dummy" repetitions
(not included in the timings) to try and reduce timing artefacts caused by JIT compilation.
The discontinuities in the graph (between 12 and 13, and between 15 and 16 MB) are probably artefacts
of processor cache effects.
If you enjoy this Java programming article, please share with friends and colleagues. Follow the author on Twitter for the latest news and rants.
Editorial page content written by Neil Coffey. Copyright © Javamex UK 2021. All rights reserved.